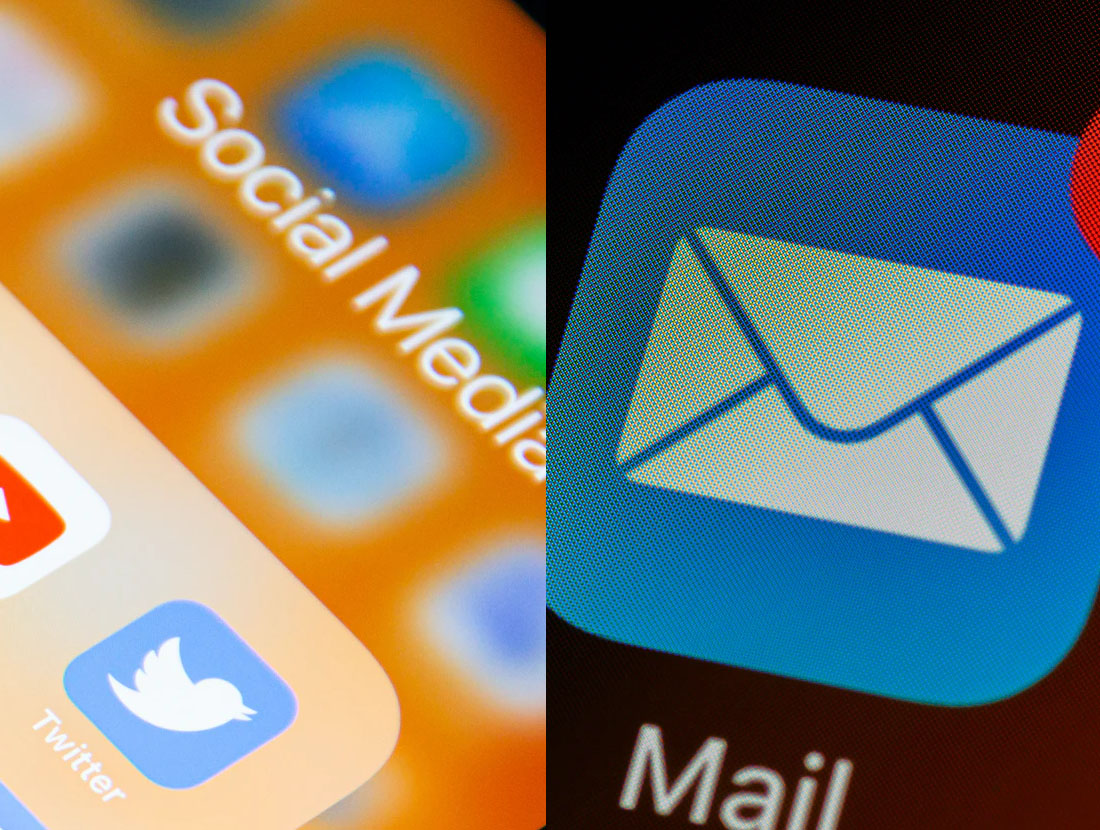
Social Media Marketing VS. Email Marketing, Two Completely Different Leagues.
 John Davidson /
 October 4, 2021 19:15 EDT
According to an article we found at OptInMonster (a customer acquisition and lead-generation application business), dated December 19, 2019, there are more than 4 billion Internet users online worldwide. Almost 80% own at least one social media account. On average, most have 5.5 accounts. In addition, nearly every social media account owner owns an email account, primarily because you need one to open a social media account.
As social media developed over the years, it became recognized as an alternative channel for marketing to reach your audience potentially. But are you getting to your audience with the right messages?
According to the article, looking at the effectiveness of using email marketing compared to social media, when looking at the ROI, email is a clear winner – and not just by a little. By a significant margin.
Below are some interesting statistics of Email vs. Social Media
|
|
|
SOCIAL MEDIA |
|
Total Users: |
3.8 billion |
3.4 billion |
|
Preferred method for promos: |
60% |
20% |
|
Actual conversion rate: |
6.05% |
1.9% |
|
Open/Click through |
22.86% or 3.71% CTR |
.58% Engagement |
|
ROI |
4,400% |
Unknown |
The email route has a larger user base over social media and the most users of any age group. This statistic is critical if you have an audience in the 45-64 age group or over 65. The social engagement of the 45-64 group drops to 64% (the email engagement remains at 90.5%), and with the group over 65+, the social engagement drops to 37%, whereas email remains high at 85.5%.
Another exciting piece of information is that 58% of people open their emails first when they wake up. It just so happens that this particular group may also be your customers! After that, 14% will check their social media.
To put the icing on the cake, the group that first opens their email is recognized as more task-oriented than those who begin their day on social media. Therefore, the chances are also more significant for them to engage in an online interaction like looking for deals, promotions, or new information about products and services.
We further found it interesting that 60% of consumers will subscribe to a company email list permitting them to receive promotional messages, versus 20% who will follow a brand on social media to get deals. Thus, when consumers are looking for a bargain, email is the preferred method of update.
What else did we find? For example, 44% of people comb their email for a deal or information from a company they recognize or know, versus 4% check Facebook. In addition, 60% of consumers advised they have responded with a purchase because of an email message versus 12.5% who responded through social media.
The engagement rate through social media is slightly over half of one percent (0.58%). On the other hand, an email will reach nearly 85% of the people you send it to (inbox placement).
We found an article over at Mailchimp mentioning the actual open rates can vary between 16.65% - 27.62% with an average open rate of 21.33%, depending on your business industry. That is greater than 45 times higher engagement than social media.
According to information from Campaign Monitor, the best day for email open rates and engagement is a Friday.
Average Open Rates by Industry (Source: Mailchimp)
|
Industry |
Average Open Rate |
Average Click Rate |
Hard Bounce |
Soft Bounce |
Unsubscribe Rate |
|---|---|---|---|---|---|
|
All non-labeled accounts |
22.71% |
2.91% |
0.40% |
0.61% |
0.25% |
|
Agriculture and Food Services |
23.31% |
2.94% |
0.32% |
0.50% |
0.28% |
|
Architecture and Construction |
22.51% |
2.51% |
0.73% |
1.18% |
0.32% |
|
Arts and Artists |
26.27% |
2.95% |
0.30% |
0.51% |
0.28% |
|
Beauty and Personal Care |
16.65% |
1.92% |
0.26% |
0.33% |
0.30% |
|
Business and Finance |
21.56% |
2.72% |
0.43% |
0.55% |
0.20% |
|
Computers and Electronics |
19.29% |
2.08% |
0.47% |
0.79% |
0.27% |
|
Construction |
21.77% |
2.26% |
0.86% |
1.28% |
0.39% |
|
Consulting |
20.13% |
2.49% |
0.50% |
0.79% |
0.27% |
|
Creative Services/Agency |
21.39% |
2.66% |
0.58% |
0.93% |
0.35% |
|
Daily Deals/E-Coupons |
15.06% |
2.23% |
0.07% |
0.13% |
0.10% |
|
15.68% |
2.01% |
0.19% |
0.26% |
0.27% |
|
|
Education and Training |
23.42% |
2.90% |
0.32% |
0.51% |
0.21% |
|
Entertainment and Events |
20.51% |
2.36% |
0.28% |
0.43% |
0.26% |
|
Gambling |
21.62% |
3.30% |
0.42% |
0.38% |
0.15% |
|
Games |
21.10% |
3.66% |
0.37% |
0.44% |
0.25% |
|
Government |
28.77% |
3.99% |
0.33% |
0.50% |
0.13% |
|
Health and Fitness |
21.48% |
2.69% |
0.30% |
0.40% |
0.40% |
|
Hobbies |
27.74% |
5.01% |
0.18% |
0.31% |
0.23% |
|
Home and Garden |
21.60% |
3.03% |
0.32% |
0.52% |
0.35% |
|
Insurance |
21.36% |
2.13% |
0.67% |
0.71% |
0.25% |
|
Legal |
22.00% |
2.81% |
0.52% |
0.66% |
0.22% |
|
Manufacturing |
19.82% |
2.18% |
0.72% |
1.18% |
0.31% |
|
Marketing and Advertising |
17.38% |
2.04% |
0.44% |
0.68% |
0.27% |
|
Media and Publishing |
22.15% |
4.62% |
0.14% |
0.27% |
0.12% |
|
Medical, Dental, and Healthcare |
21.72% |
2.49% |
0.51% |
0.63% |
0.28% |
|
Mobile |
19.29% |
2.27% |
0.48% |
0.58% |
0.37% |
|
Music and Musicians |
21.88% |
2.94% |
0.28% |
0.48% |
0.26% |
|
Non-Profit |
25.17% |
2.79% |
0.33% |
0.49% |
0.20% |
|
Pharmaceuticals |
18.58% |
2.25% |
0.39% |
0.53% |
0.17% |
|
Photo and Video |
23.24% |
3.23% |
0.43% |
0.65% |
0.40% |
|
Politics |
22.94% |
2.37% |
0.28% |
0.41% |
0.21% |
|
Professional Services |
21.94% |
2.55% |
0.56% |
0.83% |
0.31% |
|
Public Relations |
21.02% |
1.98% |
0.45% |
0.71% |
0.17% |
|
Real Estate |
19.17% |
1.77% |
0.38% |
0.56% |
0.27% |
|
Recruitment and Staffing |
21.14% |
2.53% |
0.45% |
0.53% |
0.30% |
|
Religion |
27.62% |
3.16% |
0.17% |
0.25% |
0.15% |
|
Restaurant |
19.77% |
1.34% |
0.37% |
0.50% |
0.28% |
|
Restaurant and Venue |
20.39% |
1.40% |
0.32% |
0.45% |
0.39% |
|
Retail |
18.39% |
2.25% |
0.22% |
0.32% |
0.25% |
|
Social Networks and Online Communities |
21.06% |
3.32% |
0.20% |
0.34% |
0.22% |
|
Software and Web App |
21.29% |
2.45% |
0.65% |
0.97% |
0.37% |
|
Sports |
24.57% |
3.09% |
0.26% |
0.39% |
0.28% |
|
Telecommunications |
20.92% |
2.27% |
0.63% |
0.87% |
0.23% |
|
Travel and Transportation |
20.44% |
2.25% |
0.31% |
0.51% |
0.24% |
|
Vitamin Supplements |
15.03% |
1.62% |
0.23% |
0.36% |
0.27% |
|
Average Totals |
21.33% |
2.62% |
0.40% |
0.58% |
0.26% |
So what does all of this mean? Why is it great to own a newsroom with PRKarma.com?
Your newsroom can effectively be a communication tool to keep your customers up to date using an option in your newsroom, “Only send to my newsroom followers and update my newsroom” when you update your newsroom with a piece of information. Because your customer has subscribed to follow your news and email statistics have shown to be more effective than social media, this should translate into a healthier response rate.